
Statistical data can be classified in several ways. Here we provide an overview of the major types of data in statistics. This article is intended to provide a 30,000 foot overview, while a deeper dive on some of these categories can be found on other pages.

Quantitative vs. Qualitative Data
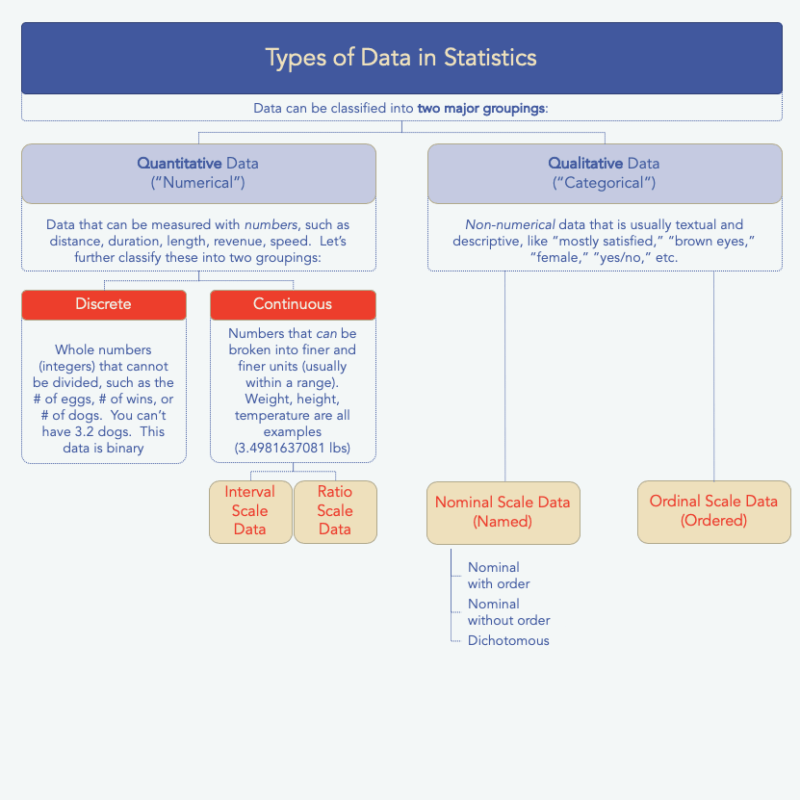
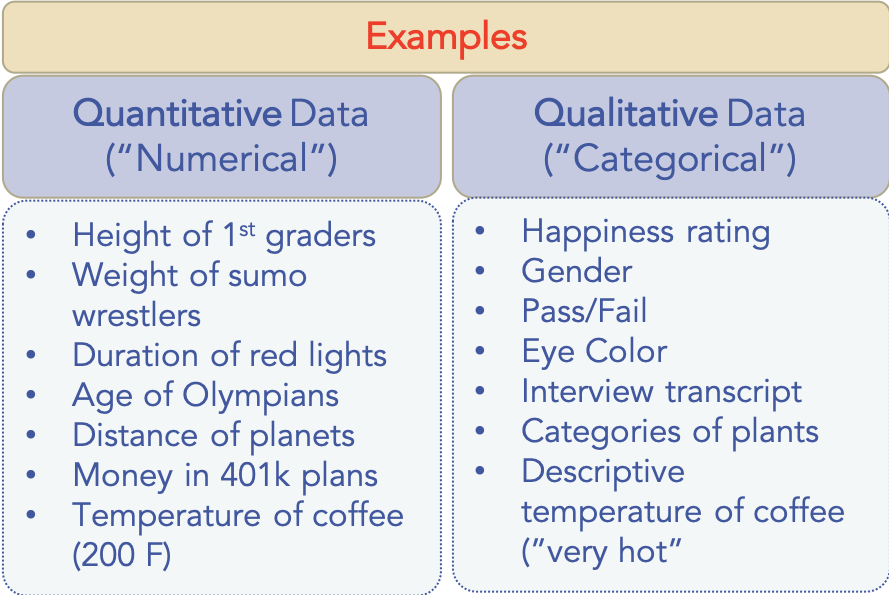
Our first characterization is whether the data is numerical or not. This one is pretty simple to understand. If you’ve got numerical data, you’ve got quantitative data. If you don’t have numbers, you’ve got qualitative data (non-numerical, or also called categorical data). See the sidebar for some examples.

Since “quantitative” and “qualitative” are almost identical in spelling, it’s easy to mix them up. The way I remember is that qualitative has an “l” it in and I always think of “l for letters.” Hope that helps you too.
By the way, I’ve written an entire post on quantitative vs. qualitative research, which of course covers the ways to obtain such data. Take a look there for more info.
Discrete vs Continuous Data
Within quantitative (or numerical) data, there exists a sub-level of data types: discrete data or continuous data. I think you’ll find this characterization very simple to understand as well.
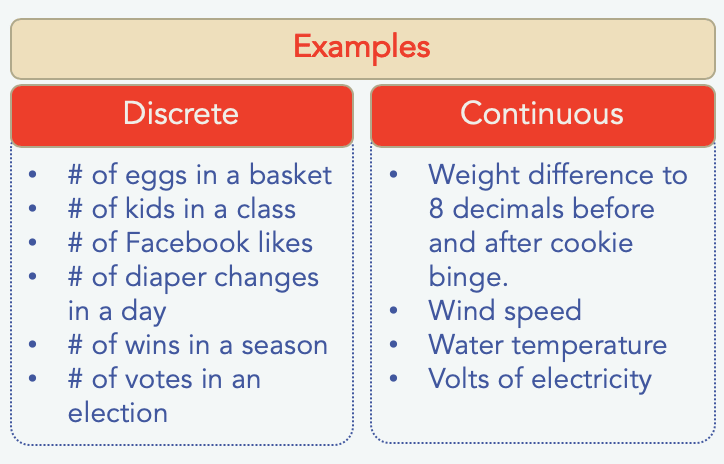
Discrete data is a whole number (integer) and it can’t be subdivided into smaller and smaller parts. Classic examples are the # of people in a classroom, # of brothers in a family, etc. You can’t have 30.5 people in the class and you can’t have 1.5 brothers. There are plenty of other examples as well, like the # of wins a rugby team gets in a season or the number of fish inside a fish tank.
Continuous data continues on and on and on, at least that’s how I think about it. These are data that can be broken into smaller and smaller units. My weight can be infinitely measured using precision equipment and doesn’t have to stop at 3 meters. Usain Bolt’s 100m time is another example of continuous data, because it could be measured to the nanosecond and beyond.

Continuous data can be further categorized into a couple of types: interval and ratio. These are classifications of data scales and you can read all about them in their own post about the types of measurement scales in statistics. In fact, you’ll find some data scales there that apply to qualitative data as well, which takes us back to the top-level category.
Summary
Hopefully you are well versed on the major types of data in statistics at this point. Remember that the top-level category is either quantitative or qualitative (numerical or not). From there, quantitative data can be grouped into “discrete” or “continuous” data. That covers most of it. From there, further classification on data scales is possible and there are of course other types of data categories we could talk about, like univariate, bivariate, multivariate; percentages and ratios, and so on, but we’ll leave those for another post. Hope this helps!
Quiz Time!
Think you understand this stuff fully? Let’s find out. Here’s a fast and fun 10 question quiz to make sure you nailed it (quiz not showing? Try on a desktop browser).
