Quantitative vs. Qualitative Research: What’s the Difference?
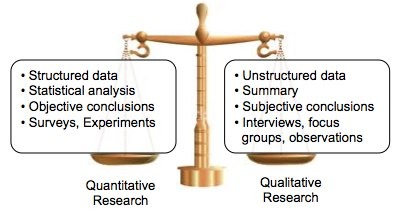
One way to classify market research is by quantitative vs. qualitative techniques. A proper explanation of quantitative vs. qualitative research follows, but if you want to keep this topic very simple, think of quantitative data as structured (numerical) data that can be plugged into a spreadsheet and analyzed with statistical methods. Conversely, think of qualitative data as unstructured information (focus group comments, observations, etc.) that is summarized subjectively, as opposed to mathematically. As one commenter pointed out, a good way to remember this is that “quantitative” sounds like “quantity,” which is a reference to numbers, and “qualitative” sounds like quality, which is generally described in words or observations.
If you are more interested in the types of data in statistics, there’s a post on that topic here. If you want to know about the research methods to obtain both quantitative and qualitative data, read on.

Ok, now for the next level of detail and some examples:
Quantitative Research
This research aims to objectively measure the topic at hand, using mathematics and statistics. If you are doing quantitative research, you will most likely be analyzing raw data with the help of a spreadsheet software program like Microsoft Excel, or a statistical package like SPSS. To facilitate this type of analysis, your data will need to be gathered in a structured format. Quantitative research is often conducted using market research methods like surveys and experiments, which are best at collecting structured data.
Remember that original primary research may not be necessary to conduct quantitative analysis. There are many secondary research data sources available that have structured data perfect for quantitative analysis (a good example is gapminder).
Example of Quantitative Research
Let’s say you wanted to know the average height of all professional basketball players in the NBA. To conduct that research, you could do a survey and call up each player on the phone and ask them for their height. You could physically find them and measure them. Both would be examples of primary research, but I’d opt for secondary research and simply compile the data from nba.com. As you can see, quantitative research can come in many forms, including surveys, observation, experimentation, and secondary research. All of these techniques will help you obtain numerical (“quantitative”) data. Awesome examples of quantitative data visualized can be found at our world in data.
Qualitative Research
Unlike quantitative research, qualitative research is typically unstructured and exploratory in nature. In this case, the researcher is not interested in determining objective statistical conclusions or in testing a hypothesis, but rather in gaining insights about a certain topic. Common qualitative research techniques include focus groups, interviews, and observation.
Since the data is unstructured–imagine a bunch of handwritten notes from a focus group meeting–it can be tricky drawing conclusions and presenting the findings. In the case of interviews and focus groups, the moderator may simply take some time to write up the key points heard in the meeting, and then present those key points to the interested parties. For example, in a focus group about pizza, you might see the following summary: “common concerns among participants were cheese overuse, greasiness, and bland sauce.”
Another approach when it comes time for qualitative analysis is to “code” the unstructured data, in an attempt to form the data into something that can be summarized with tables or charts. If the researcher conducted 20 interviews and asked similar questions to each person, responses might be summarized, or “coded,” into short descriptions. A coded response to the question “when do you wear a watch?” might be something like “3 – formal situations.” You can imaging other answer codes might be “1 – never,” “2 – everyday,” etc. With the conversations summarized into these coded responses, the data has been converted from purely qualitative data into quantitative data that can be summarized in charts and graphs.
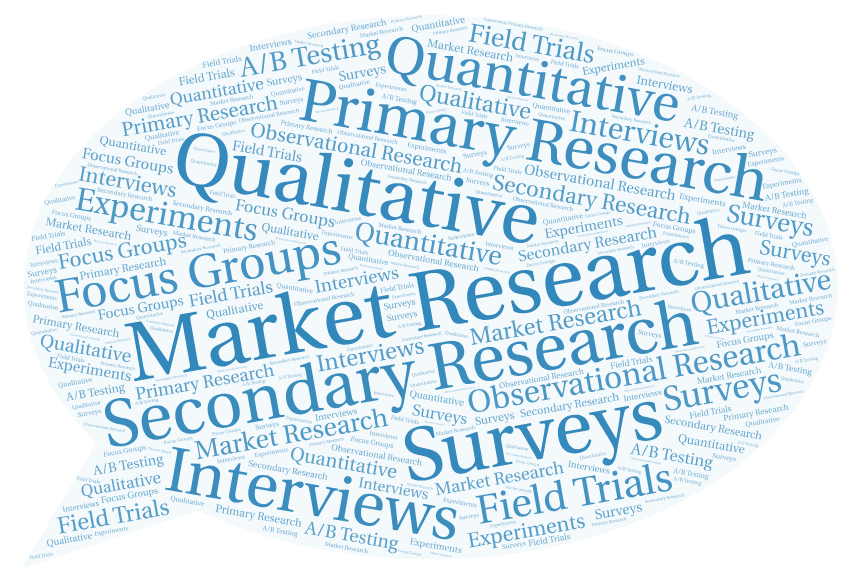
Yet another qualitative analysis method is automated content analysis. Let’s say you have a big heap of unstructured text that you’ve typed up during a focus group. You could manually look through the notes and draw some conclusions. You could also take that text and dump it into a content analyzer (e.g. wordle), that will look for word frequency and kick out a nifty “word cloud” of the key words being used. This method provides a quick way to gain insights into the unstructured data, especially when the set of data is overwhelmingly large.
Example of Qualitative Research
Let’s look at an example of qualitative research from start to finish. Imagine you work at a bowling alley and you have a little form at each lane that asked “how was your experience today?” Let’s assume there are 100 responses, including comments like “great, the staff was so courteous” and “terrible, I’ve never bowled so poorly in my life.” When the boss asks, “how is the feedback so far?” you scratch your head because you are not quite sure how to summarize the data. You have a few choices here:
- You could take the pile of 100 cards and dump them on your boss’ desk and say, “here, why don’t you look through them yourself?” Some managers will be OK with this response, while others will fire you on the spot.
- You could look through the cards, notice some key themes and tell your boss, “most of the feedback is positive, but there were several comments about the bathroom being too dirty.” That’s better than option 1.
- You could go a step further and “code” each response into a spreadsheet, perhaps classifying each response as positive, negative, or neutral, and perhaps into sub-categories like “food,” “cleanliness,” “staff,” or whatever makes sense. They you could return to your boss and say something like “65% of responses were positive, with 1/3 of those mentioning the food.” Now you are a great employee and you’ll probably get a promotion.
The word cloud below is an example of a creative way to visualize qualitative data. This displays the frequency of MLK’s famous “I have a dream” speech where words of higher frequency are displayed larger than those with fewer mentions. This could be especially useful when you have a large set of open-ended responses and you want a quick way to visualize the themes.

Here’s a helpful hint if you are ever stuck trying to remember the meaning of these words: quantitative and qualitative. After all, they are almost identical. Remember that qualitative has an “l” just like “letters” so that’s the one that deals with categorical data (non-numerical).
Great explanation. Thanks for the info, now I understand the difference between qualitative and quantitative research. 🙂
Both the quantitative as well as qualitative research methods have its pros and cons, but the quantitative research seems to be more convenient.
Thank you so much for your great explanation. It did really help me on my final test 🙂
Thank u so much..simply and great explanation …clearly understand those things.
great explanation thanks a lot
Great information provided. It was a refresher from previously learning it some years ago. A way that I remember the difference is: Quantitative – Quantity – which refers to numbers, and Qualitative – Quality – deals with what people say and what is observed.
That’s a great tip. I’ll add it to the article.
I have been struggling to understand the difference between qualitative and quantitative, but know i can collect an excellent data. thank you so much.